In the “Reports” tab you can see how many relations you have in each status.
You can see it on the pipeline or on the pie chart.
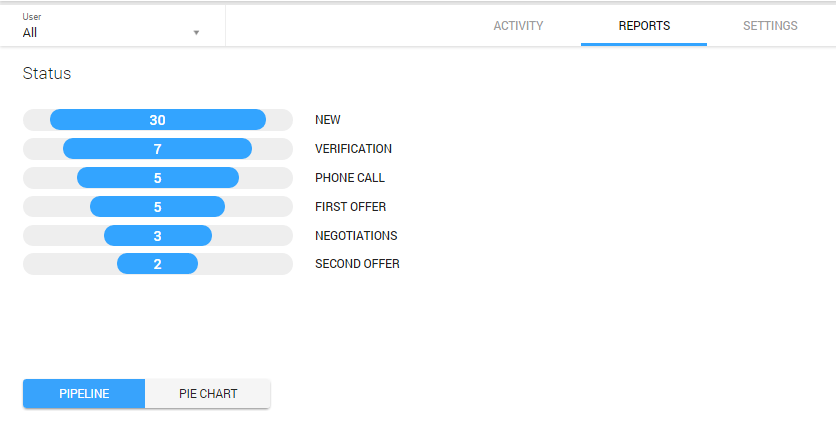
The pipeline
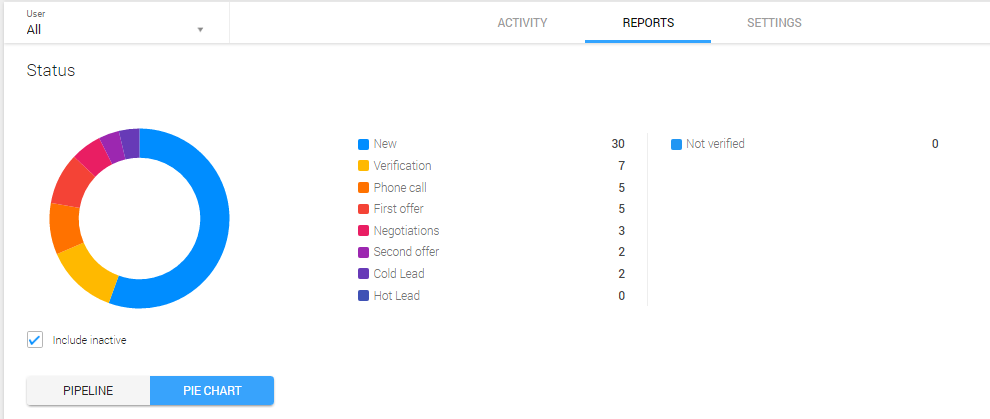
The pie chart
In this section at the bottom of the page, you can also see the bar graph which shows your effectiveness – how many leads you converted as opportunities and lost.
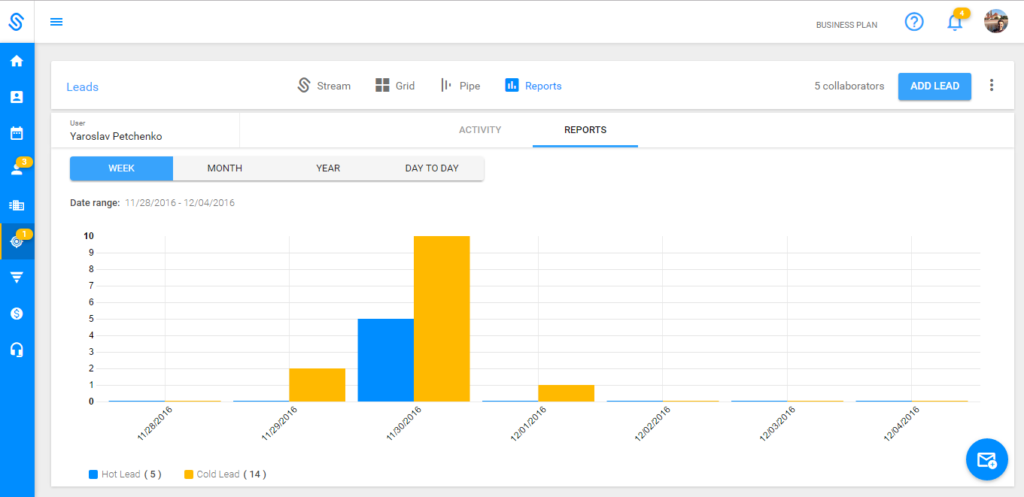
The bar graph